
Tensions due to land-use change
Culturally diverse populations in the inner-city often suffer from high levels of deprivation. The property available in these areas is often in high demand and some private developers and businesses are willing to pay high sums to purchase it. Regeneration schemes are common, often forcing residents to relocate.
Community involvement is largely limited in regeneration schemes and the lack of affordable housing increases as local residents are not taken seriously and consulted properly. Many inner-city areas in London, Birmingham and Manchester are being gentrified and ‘socially cleansed’ this way.
Attitudes towards regeneration
Those in favour of the regeneration schemes argue that they will create jobs, improve the urban environment and improve the reputation of areas.
Others cite the phenomenon of ‘white flight’ – the movement of an existing population from an area due to the overwhelming presence of an incoming ethnic group. This feeling can be enhanced by the establishment of highly specific ethnic services for the immigrant group e.g. madrassa schools.
Others have resisted such change rigorously and sometimes violently, such as the riots in Brixton (1981), Broadwater Farm (1985) and Bradford (1995). These riots have often been triggered by an unrelated event (e.g. an arrest or assault) but reflect deep-seated grievances.
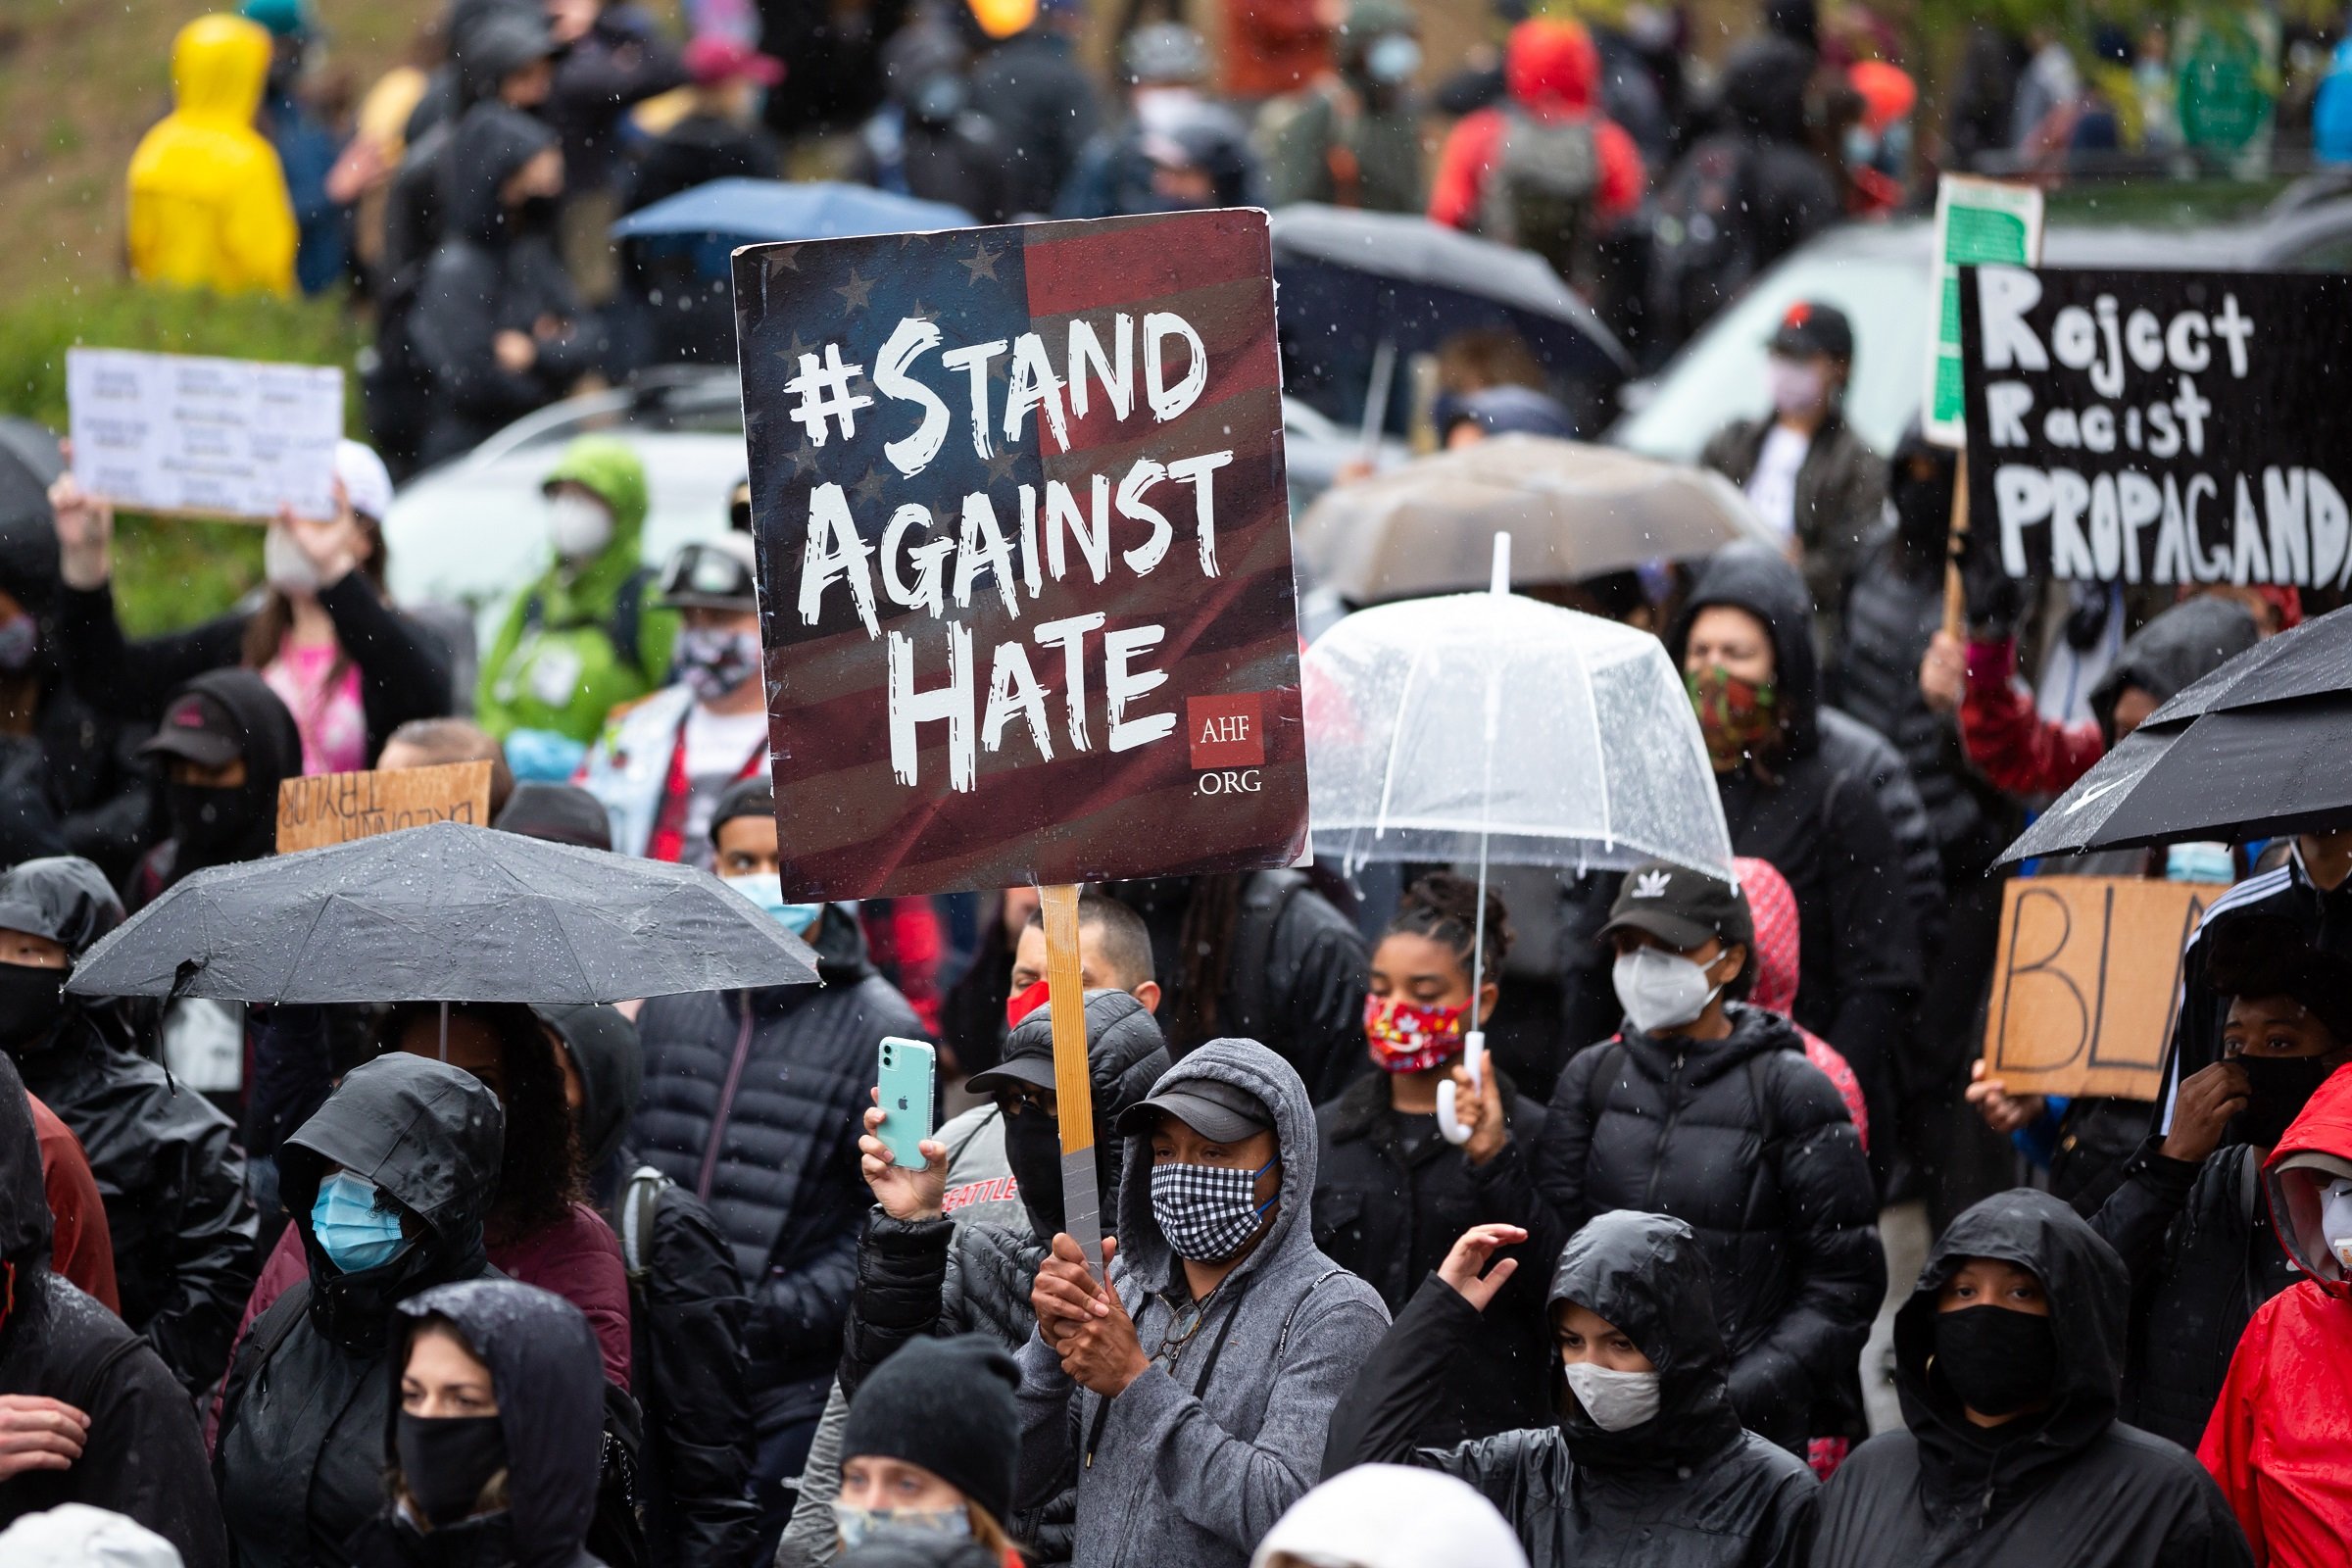
Hate Crimes
Hate crimes have risen since 2011/12. If ethnic minority groups and the wider UK society were living more peacefully together, we might expect to see a fall in hate crimes over time.
Hate crimes are described as a crime motivated wholly or in part by the victim’s identity, particularly their race, religion, sexual orientation, disability or gender identity. There have been sharp increases in the number of hate crimes towards all these strands in recent years. Note that the changes in methodology of collecting crime statistics and greater reporting of hate crimes (i.e. better awareness of it) could affect these statistics.
- 74% increase in race-related hate crimes between 2012 and 2017.
- 268% increase in religion-related hate crimes between 2012 and 2017.
- 111% increase in sexual orientation-related hate crimes between 2012 and 2017.
- 218% increase in disability-related hate crimes between 2012 and 2017.
- 299% increase in transgender-related hate crimes between 2012 and 2017.
